Get in touch
555-555-5555
mymail@mailservice.com
Real Estate Blog
For a map of real estate projects/development as well as key intersection details/analysis

Tradewinds St. Pete Beach Expansion Vote Delayed - Tampa Bay Business Journals

Ybor Harbor, Darryl Shaw's waterfront vision, gets preliminary nod from Tampa City Council - Tampa Bay Business Journal Darryl Shaw's vision for downtown Tampa's waterfront, known as "Ybor Harbor," received initial approval from the Tampa City Council. The approved plan includes a comprehensive amendment and rezoning to develop approximately 33 acres along the Ybor Channel. The centerpiece will be a public waterfront area featuring 100,000 square feet of open space with amenities like a boardwalk, restaurants, retailers, and green areas. Additionally, the project will incorporate 500,000 square feet of office space, 800 hotel rooms, 150,000 square feet of retail space, and 4,750 residential units, with 10% designated for affordable housing. More information can be found with the Tampa Bay Business Journals at the link above.
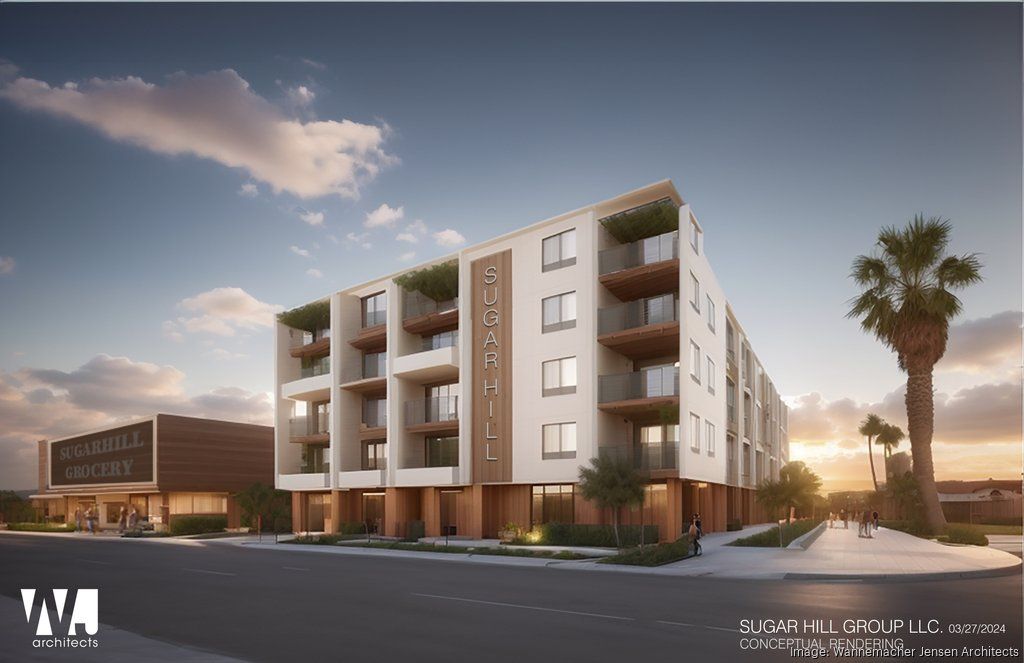
The Sugar Hill Group that wants to redevelop the city-owned Tangerine Plaza shopping center has released their third iteration of plans since they won the bid for the project nearly four and a half years ago. They were first selected by former Mayor Rick Kriseman for the project. Tangerine Plaza was formerly home to a Walmart Neighborhood Market that closed back in 2017. The plaza is on the 1700 block f 22 nd Street S in South St. Petersburg. New plans unveiled on Tuesday include a 10,000+ SF grocery store and 115 units of affordable housing. Roy Binger and Rev. Louis Murphy of Sugar Hill held a press conference on Tuesday to drum up community support prior to their pitch in front of city council which can be expected in the next few weeks. Sugar Hill announced that they have secured a partnership with New Urban Development, the real estate development affiliate of the Urban League of Greater Miami. New Urban Development has delivered over 1,300 affordable housing units through various partnerships and has over 1,500 units in its “current and active pipeline” per the company website. Binger and Murphy, both say it is crucial for the team to receive site control to move forward with securing a grocer for the space. The area was declared a food desert after Walmart closed in 2017. Murphy says they are in negotiations with several grocers for the space, but declined to name them until agreements are finalized. He says the area has many issues, and they want to find a tenant who wants to come to the community. Binger says they are leaning on New Urban Development to finance the affordable housing units, and also mentioned Community Redevelopment Area funds and local and state housing funding could support the project. He mentions site control will be needed before they can assemble a package for the units. Mayor Ken Welch has voiced support for Sugar Hill, but some city Council members have expressed concerns as to how long the project has taken to get started and doubt over whether a 10,000 SF space could secure a long-term grocery tenant. “What we really need you to do is to call city council folk,” Murphy said. “There’s a few on city council that don’t want us to be here, truth be told, but we know we’re going to be here because we believe this is something that is divinely given, and certainly this vision will feature the future of our community.”

BayCare Health Systems has revealed construction plans for a new $548 million hospital – the first one for the Health System in Manatee County. The facility will have 154-beds and is planned to be on Moccasin Wallow Road, a growing area north of the intersection of I-75 and I-275, making it accessible to residents in southern Pinellas County. BayCare Hospital Manatee will have an emergency room and facilities for orthopedic and specialty surgery, urology, gastroenterology, cardiology, diagnostic and interventional imaging, obstetrics, and neonatology according to a press release. Additionally, there will be a 45,000 SF building with outpatient services and offices for physicians. Construction is slated to begin in October. “At BayCare, our mission is to serve the community’s health and we are so excited to be deepening our commitment to the residents of Manatee County,” said Stephanie Conners, BayCare president and CEO in a statement. “As West Central Florida continues to grow and thrive, we are committed to investing in our communities to bringing high-quality and compassionate care closer to our communities.” The new hospital will be the first in Manatee County built north of the Manatee River, an area that has been seeing lots of development in the past two decades. It will also be the first non-profit owned hospital in the county. BayCare says the hospital shows signs of commitment of the Health Care System to meet the needs of fast-growing communities in and around Tampa Bay. Source: TBT Thank you for your interest. If you need Appraisal & Valuation services in the Sarasota-Manatee area, contact: Mike Cliggitt, MAI, MRICS, CCIM 813.405.1705 - Direct Line findvalue@cliggitt.com

Fort Lauderdale-based BBX Logistics Properties and Jacksonville-based FRP Development have formed a partnership to build a new 213,500 square-foot industrial park off Interstate 4 in Lakeland. The industrial park will be located on 22.5 acres of land at 8255 State Road 33 N., north of the interstate and close to an Amazon facility. The land was purchased for $2.8 million last month to an LLC that shares an address with BBX. Previously, it was purchased in 2008 for $1.35 million. The deed shows that the sale included 5 parcels, as well as a portion of a sixth. Business Observer Florida is reporting that the parcel with the address of 8255 N State Road 33 will contain the industrial park. A copy of the deed can be downloaded here. A news release for the park did not provide many details but described the project as a “state-of-the-art logistic” facility. A spokesperson has said the estimated development cost for the project is around $25 million. Despite the vast expansion of industrial areas along the I-4 corridor connecting Tampa and Orlando, a report from CBRE in October revealed that East Polk County saw the delivery of 897,000 square feet of industrial space in the third quarter. However, the construction pipeline remained largely stagnant, with only one 80,000 square foot rear load building breaking ground. CBRE is set to handle leasing for the project once it is completed. BBX Logistics is a division of BBX Capital Real Estate and was founded in 2021. The company has described itself as specializing in “high-barrier, infill locations with direct proximity to ample labor pools, highways, port and airport infrastructure, and densely populated areas.” FRP Development has offices in Jacksonville, FL and just outside of Baltimore, Maryland. FRP’s website says the company specializes in “investment, development, management and disposition of mining, industrial, office, flex, mixed-use and residential real-estate along the Eastern Seaboard of the United States.” Source: Business Observer

According to the Wall Street Journal, U.S. office markets are facing significant challenges with rising vacancy rates, an unprecedented amount of sublease space available, and increasing defaults. Despite these challenges, office rents remain stable or are even on the rise. Data from CoStar Group reveals that the average asking rent for U.S. office spaces is currently $35.24 per square foot, up from $34.92 in the fourth quarter of 2019. This increase in asking rents highlights the unique dynamics of the commercial real estate market. Rents play a crucial role in determining a property's value, and property owners are reluctant to reduce them. This reluctance stems from the fact that lowering rents can negatively impact the appraised value of their buildings, potentially leading to loan defaults or difficulties in refinancing, as noted by David Bitner, head of global research for Newmark Group. Experts anticipate that office rents will eventually decline, especially as property owners and lenders are compelled to restructure mortgages or sell distressed properties. In the meantime, landlords are offering attractive incentives to lure tenants, such as costly interior build-outs, extended periods of free occupancy, and other perks. Phil Mobley, CoStar's national director of office analytics, mentioned instances where tenants were offered a year of free rent for a 10-year lease term, a departure from the previous standard of one month free rent for every two years. However, this strategy of offering incentives may be reaching its limits. Record-high office vacancy rates continue to climb as companies, many of which have adopted flexible workplace strategies during the pandemic, require less office space. According to CoStar, businesses occupy 200 million square feet less than they did before the recession, with an additional 150 million square feet of "negative absorption" expected in the next two years. The delinquency rate for office mortgages that have been securitized has surged to 6.63%, more than triple the rate of 1.87% in January 2020, according to Trepp. As a result, some properties will undergo restructuring, sales, or foreclosures, resetting property values to reflect actual market conditions rather than inflated rents. An MSCI index indicates that the average value of office buildings in central business districts has dropped by nearly 41% from July 2022 to the beginning of this year. As new owners acquire properties at these reduced prices, they will have less need to maintain high rents. In fact, they may be incentivized to lower rents to attract tenants away from competitors. Cities like San Francisco, which has experienced distressed property sales, are already witnessing sharp declines in asking rents. CoStar reports that average prices have fallen to $53.78 per square foot in the first quarter of this year, down from $75.93 in the fourth quarter of 2019. Adyen, a global fintech firm, recently secured 150,000 square feet of sublease space in San Francisco for its North American headquarters. Davi Strazza, president of Adyen North America, acknowledged that the deal reflected the current market conditions. With more than 70% of current office leases signed before the pandemic, many businesses are poised to benefit from softer market conditions when their leases come up for renewal. Companies adopting hybrid workplace strategies are also contributing to the downward pressure on office rents. According to Scoop Technologies, which tracks workplace strategies, companies with hybrid approaches required employees to be in the office an average of 2.57 days in February, only a slight increase from 2.49 days a year ago. As these companies renew their leases, they tend to occupy less space, further pushing down rents, as observed by Rob Sadow, CEO of Scoop.
Disclaimer:
Please note that none of the information or opinions expressed herein are meant to convey nor should they be construed as real estate appraisal practice, brokerage practice, legal, tax, or financial advice.
Michael R. Cliggitt Individual Professional Memberships: